QuickBooks Desktop is a powerful accounting software that offers a wide range of features to help businesses manage their financials. One of the most useful features is the ability to generate and customize reports. These reports provide valuable insights into the financial health of your business, helping you make informed decisions. In this comprehensive guide, we will walk you through the process of running and customizing reports in QuickBooks Desktop, ensuring you can tailor the information to meet your specific needs.
Understanding QuickBooks Desktop Reports
Before diving into the steps for running and customizing reports, it’s essential to understand the types of reports available in QuickBooks Desktop. Reports in QuickBooks can be broadly categorized into several types:
- Company & Financial Reports: These reports provide an overview of your company’s financial status. Examples include Profit & Loss, Balance Sheet, and Cash Flow Statement.
- Customer & Receivables Reports: These reports help you track sales, payments, and outstanding receivables. Examples include Customer Balance Detail and Accounts Receivable Aging Summary.
- Sales Reports: These reports analyze your sales activities. Examples include Sales by Customer Summary and Sales by Item Summary.
- Vendor & Payables Reports: These reports track your expenses and payables. Examples include Vendor Balance Summary and Accounts Payable Aging Summary.
- Inventory Reports: These reports help you manage your inventory levels. Examples include Inventory Valuation Summary and Inventory Stock Status by Item.
- Employee & Payroll Reports: These reports provide insights into payroll and employee-related expenses. Examples include Payroll Summary and Employee Earnings Summary.
- Banking Reports: These reports help you monitor your banking transactions. Examples include Bank Reconciliation Summary and Check Detail.
- Budgets & Forecasts Reports: These reports assist in planning and comparing actual performance against your budget. Examples include Budget vs. Actual and Forecast Overview.
Important Read:- Connect Bank And Credit Cards To QuickBooks Desktop
Running Reports in QuickBooks Desktop
Running a report in QuickBooks Desktop is a straightforward process. Follow these steps to run a report:
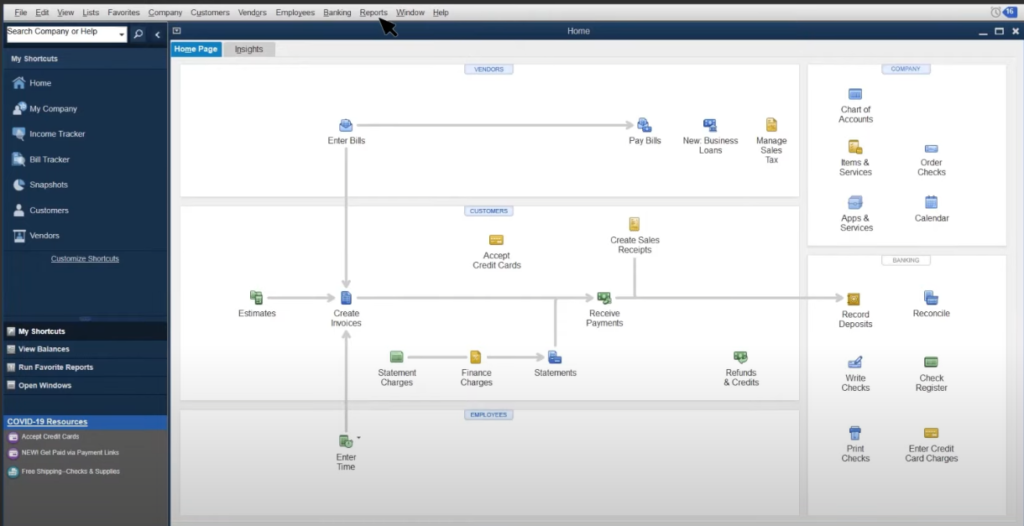
- Open QuickBooks Desktop: Launch QuickBooks Desktop and open your company file.
- Navigate to the Report Center: Click on the “Reports” menu at the top of the screen, then select “Report Center.” The Report Center provides a categorized list of available reports.
- Select a Report: Browse through the categories in the Report Center to find the report you need. You can also use the search bar to quickly locate a specific report.
- Run the Report: Once you’ve found the desired report, click on it to preview, then click the “Run” button to generate the report. The report will open in a new window, displaying the data based on the default settings.
Customizing Reports in QuickBooks Desktop
QuickBooks Desktop allows you to customize reports to better suit your needs. Customization options include modifying the date range, adding or removing columns, filtering data, and more. Here’s a step-by-step guide to customizing reports:
Step 1: Access the Report
First, run the report you want to customize following the steps outlined above.
Step 2: Open the Customize Report Window
With the report open, click the “Customize Report” button at the top of the report window. This will open the Customize Report window, where you can adjust various settings.
Step 3: Modify the Display Settings
The “Display” tab in the Customize Report window allows you to modify the appearance and content of the report. Here are some options you can adjust:
- Report Date Range: Change the date range for the report using the “From” and “To” fields. You can also select predefined date ranges from the drop-down menu.
- Columns: Add or remove columns by checking or unchecking the boxes next to each column name. You can also rearrange the order of columns by dragging them up or down in the list.
- Sort By: Choose how you want the data sorted in the report by selecting a field from the “Sort By” drop-down menu.
- Report Basis: Select either Accrual or Cash basis for the report, depending on your accounting method.
Step 4: Apply Filters
The “Filters” tab allows you to narrow down the data displayed in the report by applying specific criteria. For example, you can filter by customer, vendor, item, account, and more. Here’s how to apply filters:
- Select a Filter: Choose a filter category from the list on the left side of the window.
- Set Filter Criteria: Specify the criteria for the selected filter. For example, if you’re filtering by customer, select the customer(s) you want to include in the report.
- Add Multiple Filters: You can apply multiple filters by repeating the process for different categories.
Step 5: Customize the Header/Footer
The “Header/Footer” tab allows you to customize the header and footer of the report. You can modify the following elements:
- Report Title: Change the title of the report by editing the “Report Title” field.
- Subtitle: Add a subtitle if needed.
- Company Name: Choose to display or hide your company name on the report.
- Date Prepared: Choose to display or hide the date the report was prepared.
- Time Prepared: Choose to display or hide the time the report was prepared.
- Page Numbers: Choose to display or hide page numbers.
Step 6: Adjust Fonts and Numbers
The “Fonts & Numbers” tab allows you to customize the appearance of the text and numbers in the report. You can change the font type, size, and style for different sections of the report. Additionally, you can choose how to display numbers, such as including or excluding decimals and showing negative numbers in parentheses.
Step 7: Save the Customization
Once you’ve made all the desired changes, click the “OK” button to apply the customization to the report. You can also save the customized report for future use by clicking the “Memorize” button at the top of the report window. Give the report a name and click “OK” to save it to the Memorized Report List.
Important Read:- Enter And Pay Bills In QuickBooks Desktop
Creating Custom Reports
In addition to customizing existing reports, QuickBooks Desktop allows you to create custom reports from scratch using the Custom Report feature. Here’s how to create a custom report:
- Open the Custom Report Feature: Click on the “Reports” menu, select “Custom Reports,” and then choose either “Summary” or “Detail” depending on the type of report you want to create.
- Set Up the Report: In the Custom Report window, set up the report by selecting the data you want to include, such as accounts, customers, vendors, items, and more.
- Customize the Report: Use the customization options in the Custom Report window to adjust the display, filters, header/footer, and fonts & numbers as described in the previous section.
- Run the Report: Once you’ve set up and customized the report, click the “OK” button to generate the report.
- Save the Report: If you want to save the custom report for future use, click the “Memorize” button, give the report a name, and click “OK.”
Advanced Customization Techniques
QuickBooks Desktop offers several advanced customization techniques to further tailor your reports. These techniques include using custom fields, creating groups, and adding calculations.
Using Custom Fields
Custom fields allow you to track additional information specific to your business. You can add custom fields to customers, vendors, items, and employees, and then include these fields in your reports. Here’s how to use custom fields:
- Create Custom Fields: To create custom fields, go to the “Lists” menu, select “Customer & Vendor Profile Lists,” and then choose either “Customer Fields” or “Vendor Fields.” Click “New” to add a new custom field, give it a name, and click “OK.”
- Add Custom Fields to Records: Open a customer, vendor, item, or employee record, click the “Additional Info” tab, and then click the “Define Fields” button. Select the custom fields you want to add to the record and click “OK.”
- Include Custom Fields in Reports: When customizing a report, go to the “Columns” section in the “Display” tab and check the boxes next to the custom fields you want to include.
Creating Groups
Grouping allows you to organize data in your reports into categories, making it easier to analyze. Here’s how to create groups in a report:
- Customize the Report: Open the report you want to customize and click the “Customize Report” button.
- Select Grouping Options: In the “Display” tab, choose a field to group by from the “Group By” drop-down menu. For example, you can group transactions by customer, vendor, item, or account.
- Apply Grouping: Click “OK” to apply the grouping to the report. The report will now display data organized into groups based on the selected field.
Adding Calculations
You can add calculations to your reports to perform additional analysis. QuickBooks Desktop allows you to add custom columns with calculated fields. Here’s how to add calculations:
- Open the Custom Report Feature: Click on the “Reports” menu, select “Custom Reports,” and then choose “Detail.”
- Set Up the Report: In the Custom Report window, set up the report by selecting the data you want to include.
- Add a Custom Column: Click the “Columns” section in the “Display” tab, then click the “Add New” button to create a custom column. Enter a name for the column and specify the calculation formula.
- Customize the Report: Adjust the display, filters, header/footer, and fonts & numbers as needed.
- Run the Report: Click the “OK” button to generate the report with the custom calculation.
Important Read:- How To Setup Inventory In QuickBooks Desktop?
Best Practices for Report Customization
To ensure you get the most out of your reports in QuickBooks Desktop, here are some best practices for report customization:
- Start with a Clear Objective: Before customizing a report, define the objective of the report and the specific information you need to obtain. This will help you focus on the relevant data and avoid unnecessary complexity.
- Use Filters Wisely: Apply filters to narrow down the data and focus on the most relevant information. Be mindful of the filters you use to ensure the report remains comprehensive and accurate.
- Leverage Custom Fields: Utilize custom fields to track additional information specific to your business. Including these fields in your reports can provide deeper insights and more granular analysis.
- Regularly Review and Update Reports: Periodically review and update your reports to ensure they continue to meet your needs. Business requirements can change over time, and reports should be adjusted accordingly.
- Save Customized Reports: Save customized reports for future use to save time and maintain consistency. Memorize reports that you need to run regularly, such as monthly financial statements or sales analysis reports.
- Export and Share Reports: Export reports to Excel or PDF formats for further analysis or sharing with stakeholders. QuickBooks Desktop allows you to easily export reports, making it convenient to distribute information to others.
Common Report Customization Scenarios
Here are some common scenarios where customizing reports in QuickBooks Desktop can be particularly useful:
Tracking Sales by Item
If you want to analyze your sales performance by item, you can customize the Sales by Item Summary report. Here’s how:
- Run the Sales by Item Summary Report: Go to the “Reports” menu, select “Sales,” and then choose “Sales by Item Summary.”
- Customize the Report: Click the “Customize Report” button.
- Set the Date Range: In the “Display” tab, set the desired date range for the report.
- Add Columns: In the “Columns” section, add any additional columns you need, such as Quantity Sold or Average Price.
- Apply Filters: In the “Filters” tab, you can filter by item type, customer, or other criteria if needed.
- Group by Item: In the “Display” tab, select “Item” from the “Group By” drop-down menu.
- Run the Report: Click “OK” to generate the customized report.
Analyzing Expenses by Vendor
To track your expenses by vendor, customize the Vendor Balance Detail report. Here’s how:
- Run the Vendor Balance Detail Report: Go to the “Reports” menu, select “Vendors & Payables,” and then choose “Vendor Balance Detail.”
- Customize the Report: Click the “Customize Report” button.
- Set the Date Range: In the “Display” tab, set the desired date range for the report.
- Add Columns: In the “Columns” section, add any additional columns you need, such as Transaction Type or Memo.
- Apply Filters: In the “Filters” tab, filter by vendor, account, or other criteria if needed.
- Group by Vendor: In the “Display” tab, select “Vendor” from the “Group By” drop-down menu.
- Run the Report: Click “OK” to generate the customized report.
Monitoring Cash Flow
To monitor your cash flow, customize the Statement of Cash Flows report. Here’s how:
- Run the Statement of Cash Flows Report: Go to the “Reports” menu, select “Company & Financial,” and then choose “Statement of Cash Flows.”
- Customize the Report: Click the “Customize Report” button.
- Set the Date Range: In the “Display” tab, set the desired date range for the report.
- Add Columns: In the “Columns” section, add any additional columns you need, such as Cash Flow Category or Cash Flow Amount.
- Apply Filters: In the “Filters” tab, filter by account, customer, or other criteria if needed.
- Group by Cash Flow Category: In the “Display” tab, select “Cash Flow Category” from the “Group By” drop-down menu.
- Run the Report: Click “OK” to generate the customized report.
Conclusion
Running and customizing reports in QuickBooks Desktop is a powerful way to gain insights into your business’s financial health and make informed decisions. By following the steps outlined in this guide, you can effectively run and customize reports to meet your specific needs. Remember to utilize the various customization options, such as modifying the display settings, applying filters, using custom fields, and adding calculations, to tailor the reports to your requirements.
If you encounter any issues or need further assistance with running and customizing reports in QuickBooks Desktop, you can reach out to QB Desktop support at +1-855-838-5977. With the right reports in hand, you’ll have a clearer picture of your business’s performance and be better equipped to manage your finances effectively.
Frequently Asked Questions
To memorize a customized report, follow these steps:
1. Customize the report as needed.
2. Click the “Memorize” button at the top of the report window.
3. Give the report a name.
4. Click “OK” to save it to the Memorized Report List.
Yes, you can export reports to Excel or PDF formats. Open the report you want to export, then click the “Excel” or “PDF” button at the top of the report window. Follow the prompts to save the report in the desired format.
To apply multiple filters to a report:
1. Open the report and click the “Customize Report” button.
2. Go to the “Filters” tab.
3. Select a filter category and set the criteria.
4. Repeat the process for additional filters.
5. Click “OK” to apply the filters to the report.
Accrual basis reports recognize income and expenses when they are earned or incurred, regardless of when the cash is received or paid. Cash basis reports recognize income and expenses only when cash is received or paid.
To group data in a report:
1. Open the report and click the “Customize Report” button.
2. Go to the “Display” tab.
3. Choose a field to group by from the “Group By” drop-down menu.
4. Click “OK” to apply the grouping to the report.
Yes, you can save customized reports for different date ranges by memorizing each report with a specific name that indicates the date range. For example, you can save a Profit & Loss report for January as “P&L January” and another for February as “P&L February.”
To customize the Profit and Loss report in QuickBooks Desktop, follow these steps:
1. Open QuickBooks Desktop and go to the “Reports” menu.
2. Select “Company & Financial” and then choose “Profit & Loss Standard” from the list of reports.
3. Click the “Customize Report” button at the top of the report window.
4. In the Customize Report window, you can modify the display settings, such as the date range, columns, and filters.
5. To change the columns displayed in the report, go to the “Columns” section and check or uncheck the boxes next to the column names.
6. You can also apply filters to narrow down the data displayed in the report by going to the “Filters” tab.
7. Once you’ve made all the desired changes, click the “OK” button to apply the customization and generate the customized Profit and Loss report.
To customize a sales report in QuickBooks Desktop, follow these steps:
1. Open QuickBooks Desktop and go to the “Reports” menu.
2. Select “Sales” and then choose the sales report you want to customize, such as “Sales by Customer Summary” or “Sales by Item Summary.”
3. Click the “Customize Report” button at the top of the report window.
4. In the Customize Report window, you can modify the display settings, such as the date range, columns, and filters.
5. To change the columns displayed in the report, go to the “Columns” section and check or uncheck the boxes next to the column names.
6. You can also apply filters to narrow down the data displayed in the report by going to the “Filters” tab.
7. Once you’ve made all the desired changes, click the “OK” button to apply the customization and generate the customized sales report.
To change the format of a report in QuickBooks Desktop, follow these steps:
1. Open QuickBooks Desktop and go to the “Reports” menu.
2. Select the report you want to modify from the list of available reports.
3. Click the “Customize Report” button at the top of the report window.
4. In the Customize Report window, you can modify various formatting options, such as fonts, numbers, and colors.
5. Go to the “Fonts & Numbers” tab to adjust the font type, size, and style for different sections of the report.
6. You can also choose how to display numbers, such as including or excluding decimals and showing negative numbers in parentheses.
7. Once you’ve made all the desired changes, click the “OK” button to apply the formatting and generate the customized report.
To change a column header in a QuickBooks Desktop report, follow these steps:
1. Open QuickBooks Desktop and run the report you want to customize.
2. Click the “Customize Report” button at the top of the report window.
3. In the Customize Report window, go to the “Columns” section.
4. Click on the column header you want to change.
5. Type the new column header in the text box provided.
6. Press Enter or click outside the text box to save the changes.
7. Once you’ve made all the desired changes, click the “OK” button to apply the customization and generate the customized report.
QuickBooks Desktop does not include an auto-refresh feature for reports. Users need to manually refresh reports to fetch the most up-to-date data.